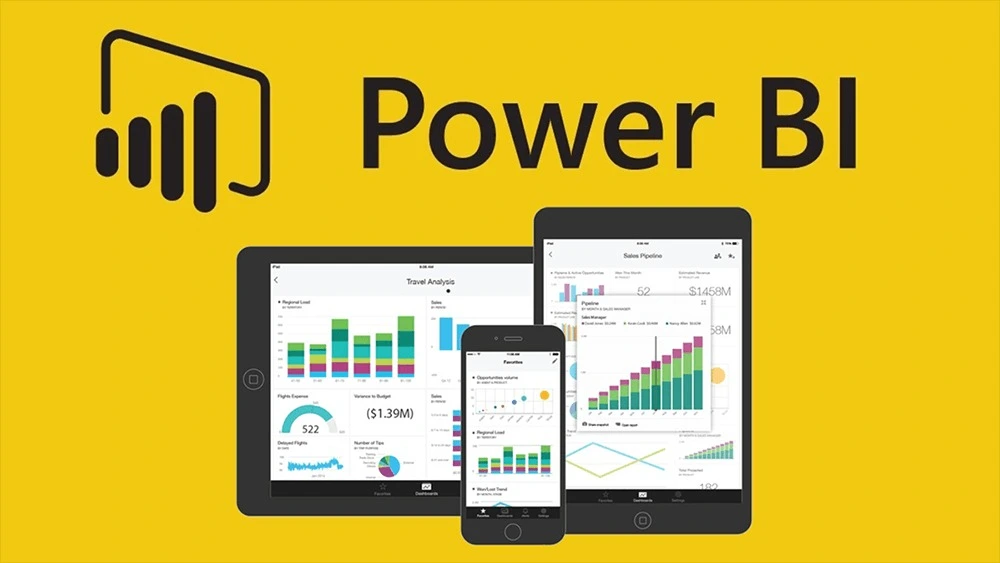
Power Bi

Microsoft Power BI course is a comprehensive program designed to equip students with the skills needed to analyze data and create interactive visualizations using Power BI. The course covers essential topics such as data modeling, data transformation, and the creation of dynamic reports and dashboards. Students learn to connect to various data sources, perform data cleaning, and utilize Power BI’s powerful visualization tools to present data insights effectively. The curriculum includes hands-on projects and real-world scenarios to ensure practical understanding and application of Power BI features. By the end of the course, students will be proficient in leveraging Power BI for business intelligence, making data-driven decisions, and providing valuable insights to their organizations. This course is ideal for professionals in data analysis, business intelligence, and anyone looking to enhance their data visualization skills.
Duration - 45 Days
Overview of Power BI
What is Power BI?
Key Features and Benefits
Components of Power BI (Power BI Desktop, Power BI Service, Power BI Mobile)
Getting Started with Power BI
Installing Power BI Desktop
Power BI Interface and Navigation
Connecting to Data Sources
Connecting to Data Sources
Importing Data from Excel, CSV, SQL Server, and other sources
Using DirectQuery vs. Import Mode
Connecting to Online Services (SharePoint, Google Analytics, etc.)
Data Transformation with Power Query
Understanding Power Query Editor
Data Cleaning and Shaping Techniques
Merging and Appending Queries
Advanced Data Transformation
Using Conditional Columns
Pivoting and Unpivoting Data
Custom Functions and Parameters
Understanding Data Modeling
Importance of Data Modeling
Creating Relationships between Tables
Data Model Best Practices
Creating Calculated Columns and Measures
Introduction to DAX (Data Analysis Expressions)
Creating Calculated Columns
Creating and Using Measures
Advanced DAX Functions
Time Intelligence Functions
Filter Functions
Statistical and Mathematical Functions
Introduction to Data Visualization
Principles of Effective Data Visualization
Types of Visuals in Power BI
Creating Basic Visualizations
Bar and Column Charts
Line and Area Charts
Pie and Donut Charts
Advanced Visualizations
Maps and Geospatial Visuals
Scatter and Bubble Charts
Gauge and KPI Visuals
Custom Visuals and Visual Interaction
Importing and Using Custom Visuals
Designing Interactive Reports
Drill-Through and Drill-Down Features
Introduction to Power BI Service
Publishing Reports to Power BI Service
Navigating the Power BI Service Interface
Data Refresh and Scheduling
Configuring Data Refresh
Managing Data Gateways
Scheduling Refreshes
Collaboration and Sharing
Creating and Managing Workspaces
Sharing Reports and Dashboards
Collaborating with Teams
Creating Reports
Designing Report Layouts
Adding and Formatting Visuals
Using Report Themes and Templates
Building Dashboards
Pinning Visuals to Dashboards
Designing Interactive Dashboards
Using Dashboard Tiles and Widgets
Advanced Reporting Techniques
Using Bookmarks and Buttons
Implementing Row-Level Security
Performance Optimization Tips
Power BI Mobile
Overview of Power BI Mobile App
Viewing and Interacting with Reports on Mobile
Mobile-Optimized Reports
Embedding Power BI
Embedding Power BI Reports in Applications
Power BI Embedded API
Customizing Embedded Reports
Excel and Power BI Integration
Importing Excel Data into Power BI
Using Power BI Publisher for Excel
Analyzing Power BI Data in Excel
Power Pivot and Power Query in Excel
Using Power Pivot for Data Modeling
Data Transformation with Power Query in Excel
Creating Excel Dashboards with Power BI Data
Introduction to Advanced Analytics
Using AI and Machine Learning in Power BI
Integrating with Azure Machine Learning
R and Python Integration
Running R Scripts in Power BI
Using Python for Data Analysis in Power BI
Advanced Analytical Techniques
Key Influencers Visual
Decomposition Tree
What-If Parameters
Module 10: Power BI Administration and Governance
Administering Power BI
Power BI Admin Portal Overview
Managing Users and Permissions
Auditing and Usage Monitoring
Governance and Best Practices
Establishing Governance Policies
Data Security and Compliance
Power BI Deployment Pipelines
Practice Exercises for Each Module
Defining Project Objectives and Scope
Data Collection and Preparation
Project Timeline and Milestones
Building Data Models and Visualizations
Creating Reports and Dashboards
Final Presentation and Review
